


Half-mast Pattern: Bayrak ve Flama Formasyonları
Coffee Break Letters #005 - 20.05.2024

Herkese merhaba,
"Half-mast Pattern" nedir ? Biraz derinlemesine bakalım.
Bayraklar ve flamalar, genellikle hızlı hareket eden ve nispeten güvenilir sonuçlar veren yaygın formasyonlardır. Birçok yetenekli trader, kapitallerini optimize etmek için bu formasyonlara güvenir. Yüksek başarı oranları, düşük düzeltme yüzdeleri ve formasyon devamında dik açılı yükseliş trendi oluşturmaları nedeniyle, bu formasyonlar oldukça etkili trade formasyonları olarak kabul edilir. Bu formasyonların en büyük ayırt edici özelliği, formasyonu takip eden dik açılı rallilerdir. Bu formasyonlar için fiyat hedefi, hareketin başlangıcından formasyonun ilk düzeltme aldığı seviyeye kadar ölçülerek ve ölçülen bu değer kırılma fiyatına eklenerek hesaplanır.

Bu hesaplama yöntemi özellikle bayraklar ve flamalar için geçerlidir. Bu formasyonlar genellikle dik açılı fiyat hareketinin tam ortasında meydana geldiği için, “Half-mast Pattern” olarak isimlendirilirler. Bayraklar ve flamalar genellikle birkaç gün ile birkaç hafta süren kısa bir dönem boyunca ortaya çıkar ve formasyon oluşumu sırasında genellikle hacim azalır.
Sevgiler,
Çağan
“Okuduğunuz için teşekkür ederim. Bu gönderi ve “Trading & Life” platformu herkese açıktır, paylaşıp bu platformu destekleyebilir ve yeni içeriklerden haberdar olmak için ücretsiz abone olabilirsiniz...”
Understanding the Half-Mast Pattern in Trading: Flags and Pennants
Hi everyone,
"What is the 'Half-mast Pattern'? Let's delve into it a bit.
Flags and pennants are often common formations relied upon by traders as they provide swift and relatively reliable results. Many skilled traders rely on these formations to optimize their capital. Due to their high success rates, low correction percentages, and the formation of steep upward trends, these formations are considered highly effective trading patterns. The most distinguishing feature of these formations is the steep upward rallies that follow them. For these formations, the price target is calculated by measuring from the beginning of the move to the level where the formation first takes a correction, and adding this measured value to the breakout price.
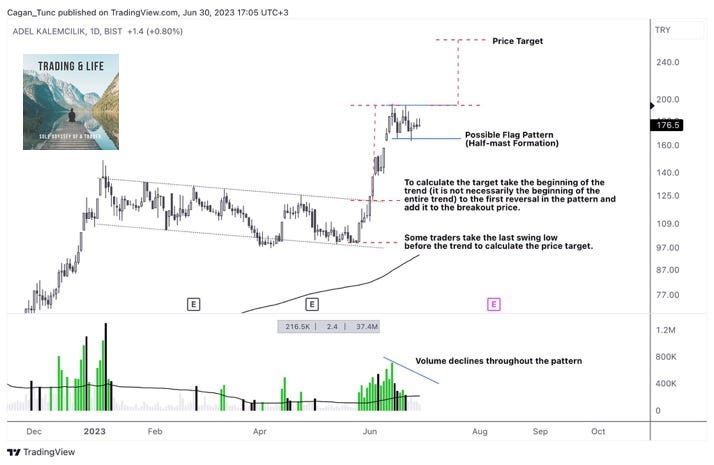
This calculation method is particularly applicable to flags and pennants. Since these formations typically occur right in the middle of a steep price movement, they are called 'Half-mast Patterns'. Flags and pennants typically emerge over a short period ranging from a few days to a few weeks, and volume usually decreases during the formation.
Cheers!
Cagan
“Thank you for reading. This post and the 'Trading & Life' platform are open to everyone; feel free to share and support this platform, and you can subscribe for free to stay updated with new content."
Teşekkürler